Web Application
DevOps & GitHub Analytics Dashboard
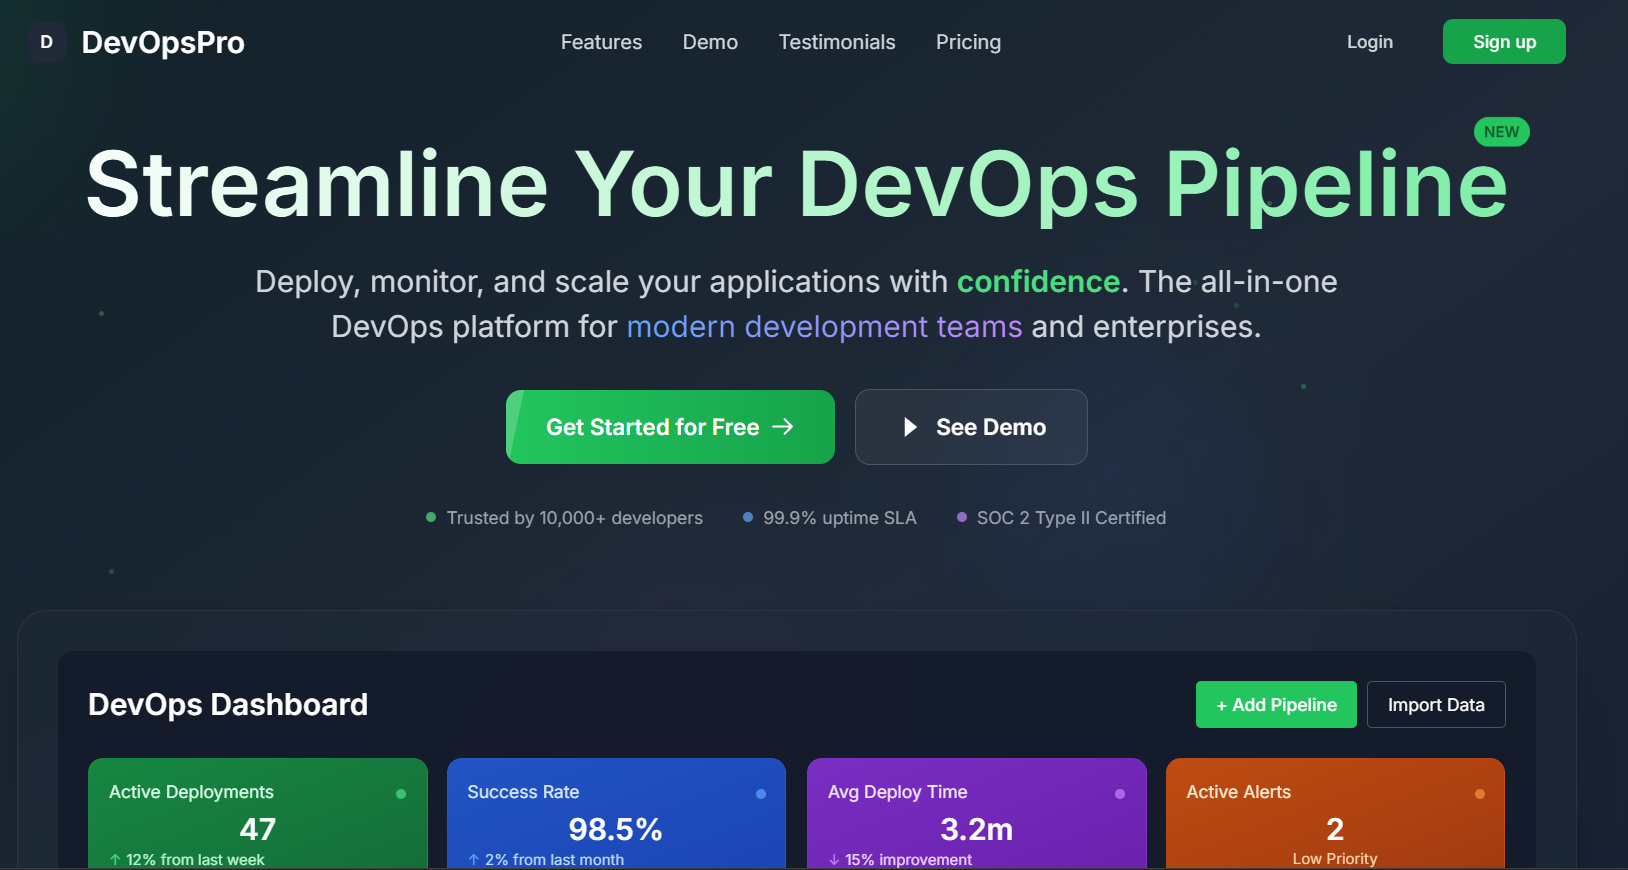
A React-based frontend dashboard providing comprehensive DevOps and GitHub analytics insights.
Project Overview
The DevOps & GitHub Analytics Dashboard is a modern web application built with React that provides comprehensive insights into development team productivity and repository health metrics.
The dashboard features detailed analytics for pull requests, code review processes, and team collaboration patterns, helping organizations make data-driven decisions about their development workflows.
Built with performance in mind using React, Vite, and Tailwind CSS, the application delivers a responsive and high-performance user experience across all devices.
Key Features
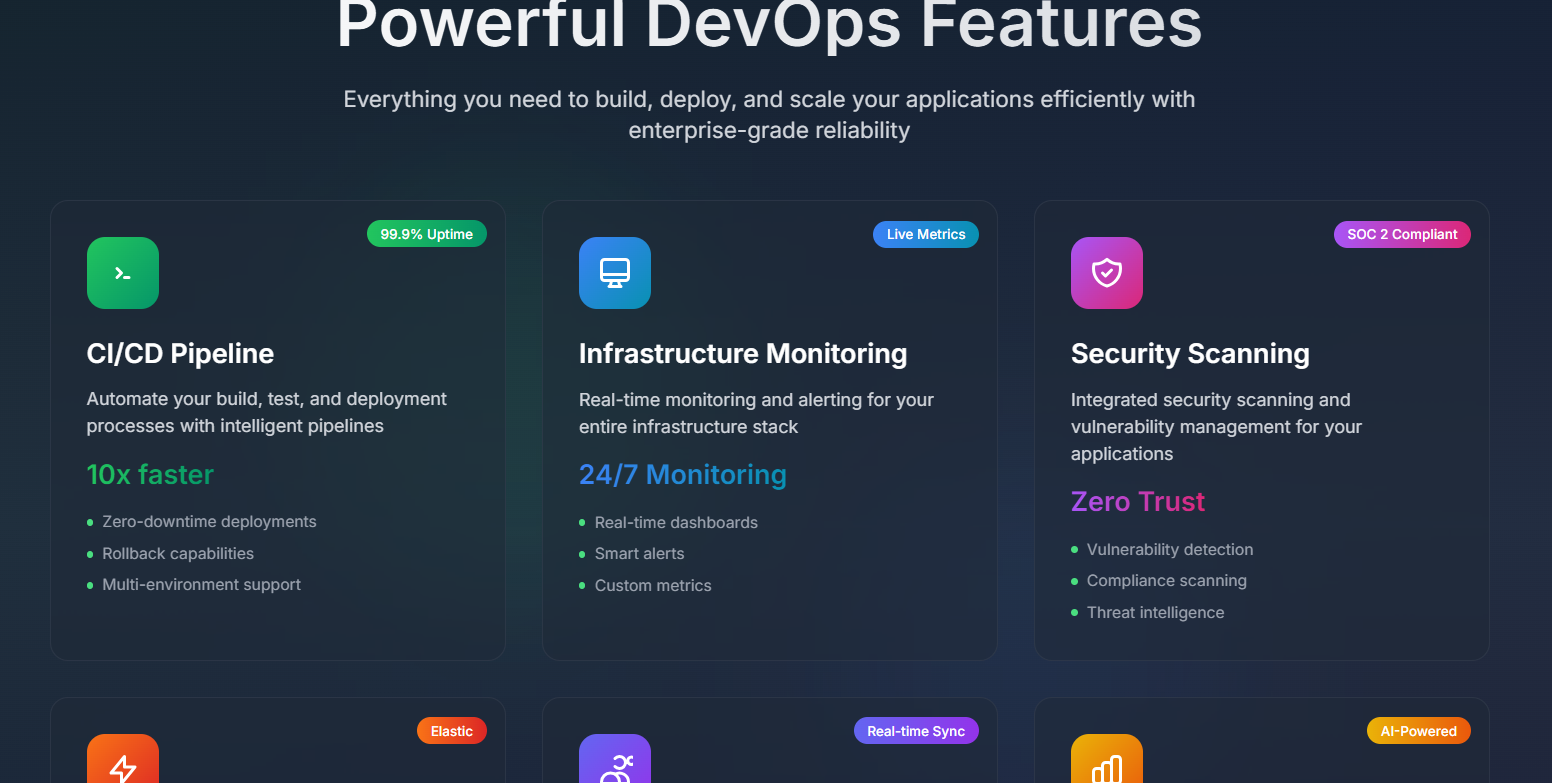
- Comprehensive pull request analytics and tracking
- Repository health monitoring and metrics
- Team productivity insights and reporting
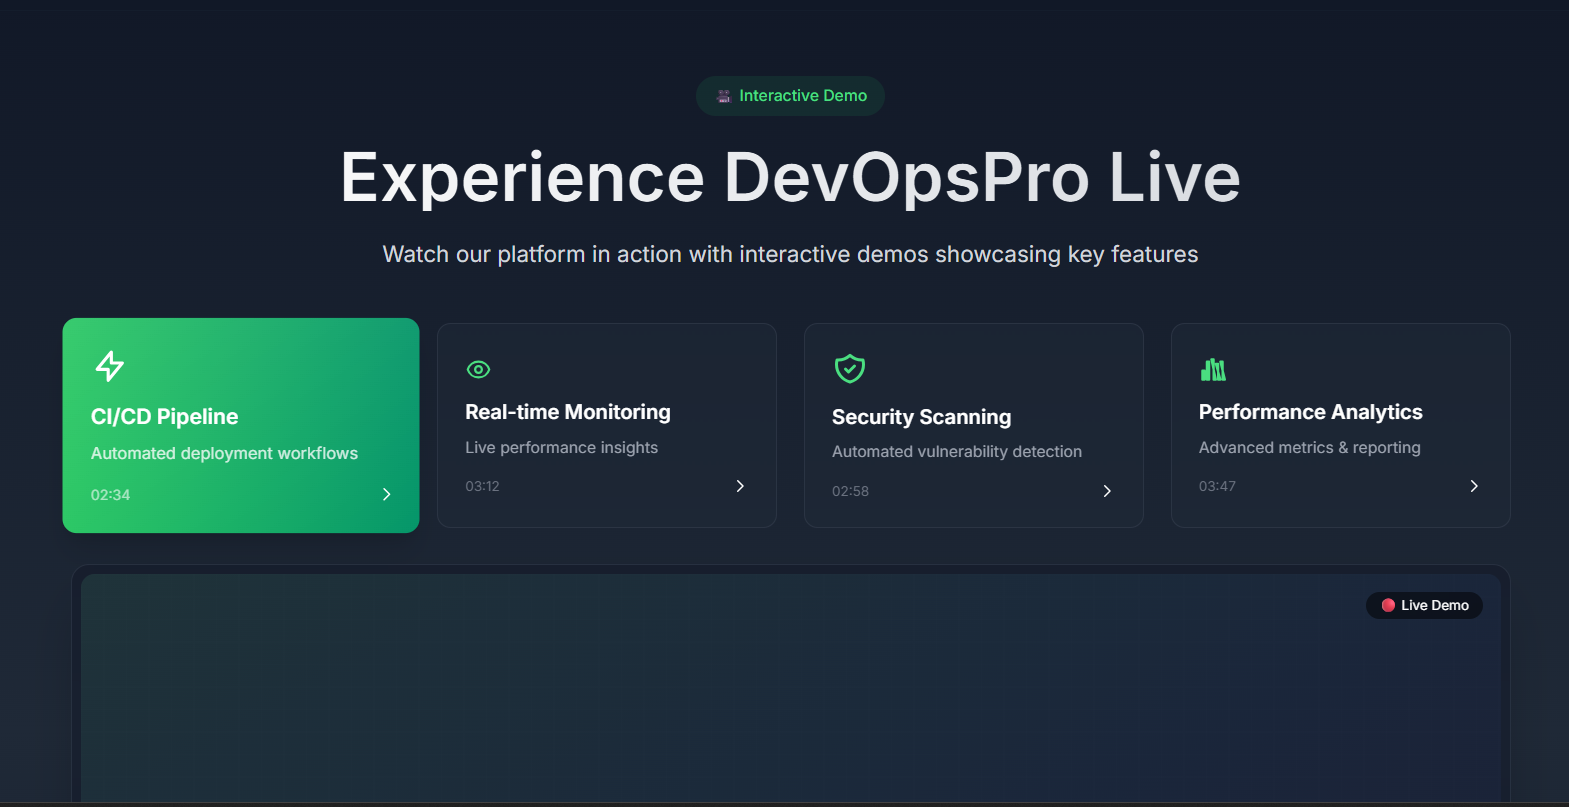
- Real-time data visualization and charts
- Responsive design optimized for all screen sizes
- High-performance build system with Vite
Technologies Used
React.jsViteTailwind CSSChart.jsGitHub APIDockerAzure App Service
Project Gallery

Project Details
Client
Personal Project
Timeline
3 months (Q1 2024)
Role
Frontend Developer
© 2025 Hetkumar Prajapati. All rights reserved.
0%